Institutional Insights: Deutsche Bank - Dollar Flow Update
.jpeg)
We previously discussed our broad perspectives as we approach year-end a few days ago: the US is currently experiencing a dual negative demand shock (from tariffs) and a supply shock (due to immigration), compounded by the potential for fiscal dominance. We believe this combination is distinctly unfavorable for the dollar. In this report, we analyze how the dollar flow landscape has changed in recent months, utilizing various tools we've developed.
Starting with developments in dollar hedging, we've gathered a significant amount of data from European pension funds through the end of Q2. Most of these funds (with Sweden being a notable exception) have shown a significant decrease in FX exposure during the first half of the year, aligning with our predictions. Additionally, we have one more data point for July from Danish funds which indicates a slight increase in FX exposure. However, as we highlight here, it's important to interpret this data carefully due to the positive valuation impacts on dollar assets throughout Q2. When adjusting for these factors, the active rise in dollar exposure in July appears minimal compared to the declines observed in prior months. Overall, we consider the collective evidence so far to indicate a substantial discretionary shift away from USD exposure during Q2, and we will closely monitor the Q3 data as it becomes available.
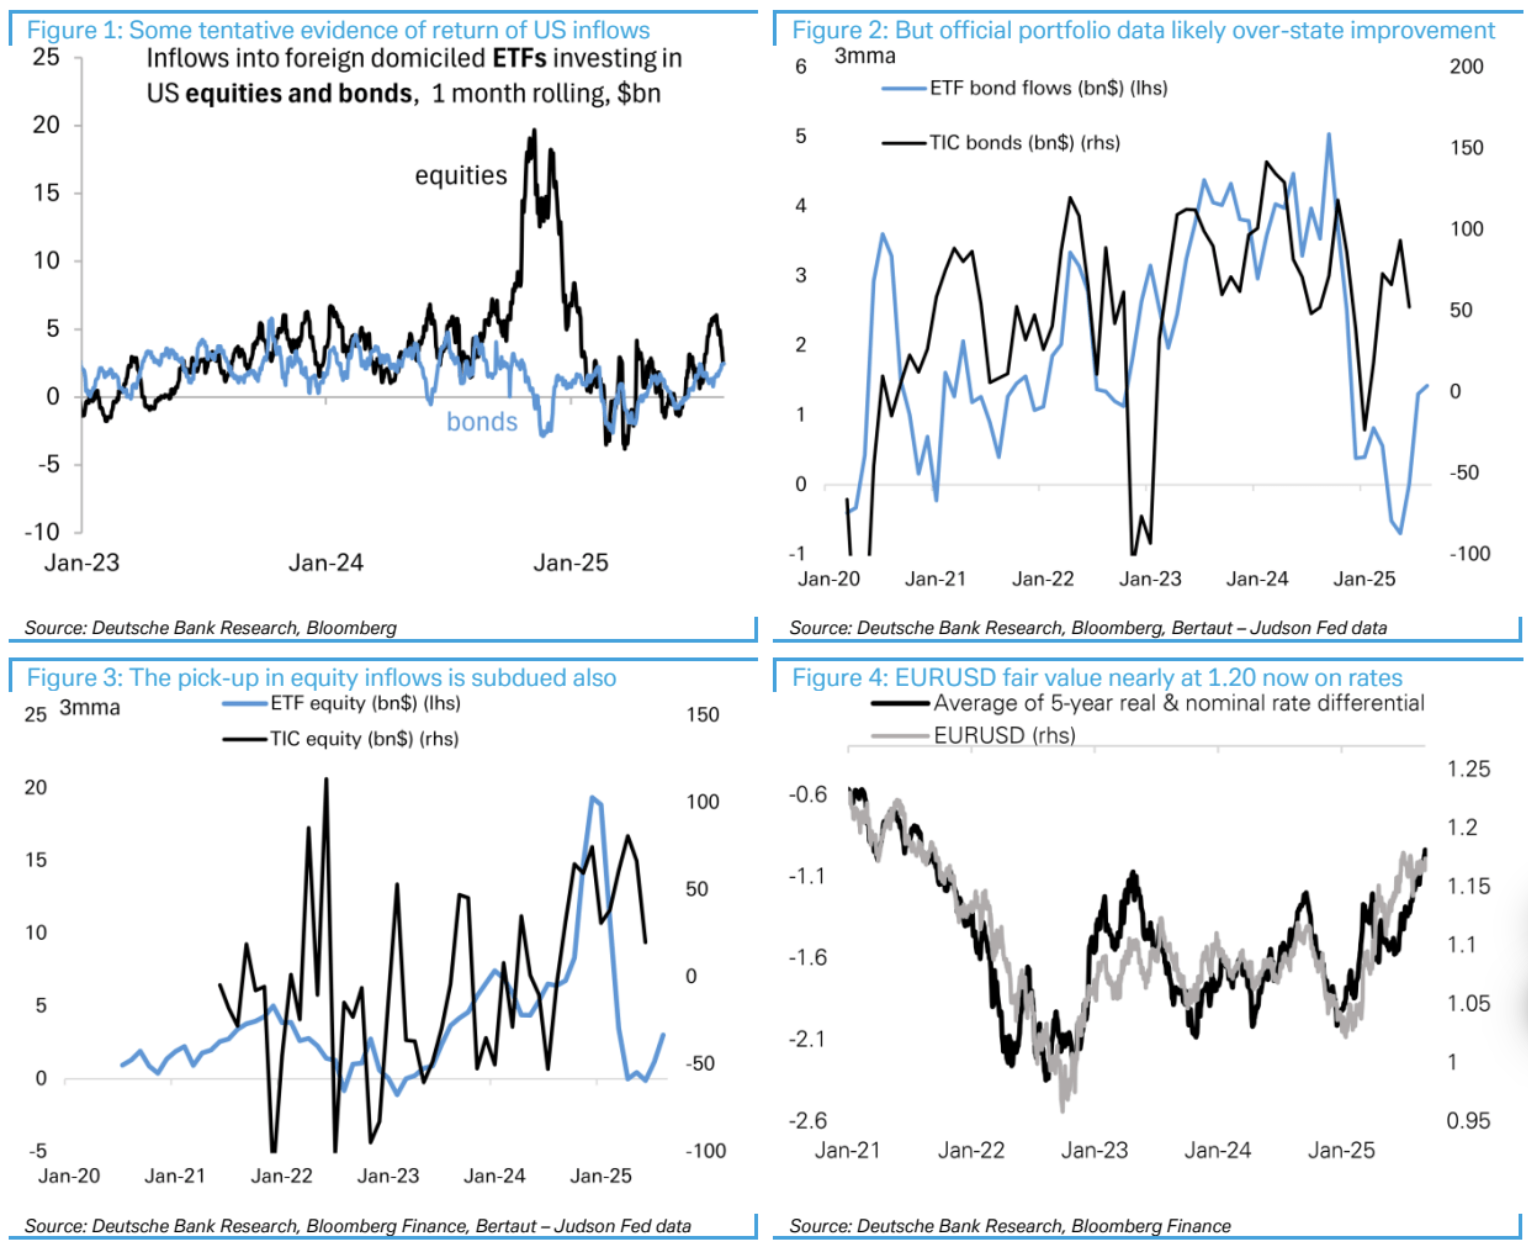
On the flow side, the data seems somewhat more favorable for the dollar. We have extensively covered the issues related to the official TIC data, which can be quite misleading. Therefore, we prefer our high-frequency trackers, cross-referenced with Fed-adjusted TIC data, to monitor flows. What does the current situation indicate? The evidence is mixed. Our highest frequency tracker indicates that after a three-month halt in buying during Q2, foreign investment in US assets has resumed over the past few weeks (as shown in figure 1). However, this data is quite volatile, and a three-month average suggests a lackluster flow, implying potential further downward risks for the Fed-adjusted TIC data in the upcoming months (as illustrated in figures 2 and 3).
What does this imply for our dollar outlook? The improvement in flow conditions has likely alleviated some extreme risks that could have arisen from a total lack of inflows. Nonetheless, uncertainty surrounding the steady demand for US assets remains significant. Meanwhile, the cyclical support for the dollar has weakened, demonstrated by a notable narrowing of the EUR-US rate differential, which now aligns with a financial fair value in the EUR/USD range of 1.18-1.20 (as shown in figure 4). It is evident that further Fed cuts would incentivize foreign investors to hedge their dollar assets. As the dollar has now eliminated any excess cheapness or risk premium associated with President Trump’s policies, the overall forecast still leans asymmetrically bearish for the dollar.
Disclaimer: The material provided is for information purposes only and should not be considered as investment advice. The views, information, or opinions expressed in the text belong solely to the author, and not to the author’s employer, organization, committee or other group or individual or company.
Past performance is not indicative of future results.
High Risk Warning: CFDs are complex instruments and come with a high risk of losing money rapidly due to leverage. 71% and 74% of retail investor accounts lose money when trading CFDs with Tickmill UK Ltd and Tickmill Europe Ltd respectively. You should consider whether you understand how CFDs work and whether you can afford to take the high risk of losing your money.
Futures and Options: Trading futures and options on margin carries a high degree of risk and may result in losses exceeding your initial investment. These products are not suitable for all investors. Ensure you fully understand the risks and take appropriate care to manage your risk.
Patrick has been involved in the financial markets for well over a decade as a self-educated professional trader and money manager. Flitting between the roles of market commentator, analyst and mentor, Patrick has improved the technical skills and psychological stance of literally hundreds of traders – coaching them to become savvy market operators!